![Twinview Academy - Purple Background (3).png]](https://content.twinview.com/hs-fs/hubfs/Twinview%20Academy%20-%20Purple%20Background%20(3).png?height=50&name=Twinview%20Academy%20-%20Purple%20Background%20(3).png)
While it’s possible to build fully custom dashboards and reports within Twinview, the Energy Performance and Insights Report provides a ready-made view of your building’s energy performance using recognised industry standards and methodologies, such as CIBSE TM54.
Understanding the Report
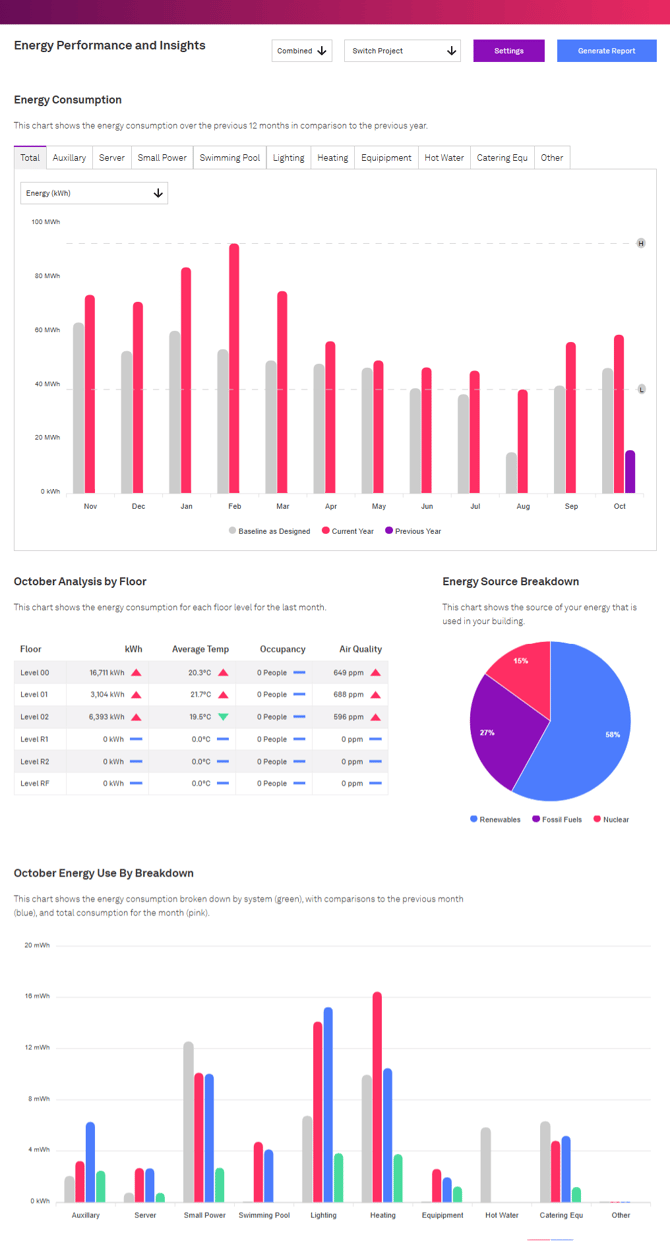
The Energy Performance and Insights dashboard displays your real-time energy consumption alongside your benchmark data, helping you track how your building performs against design expectations and previous-year results.
You can access the report from the main left-hand menu while working on a project.
12-Month Chart
The 12-month chart visualises your building’s energy consumption month by month over the past year.
It shows:
- Current year data (red)
- Previous year data (purple)
- Baseline data (grey), based on your building’s original design methodology
This layout allows you to easily compare year-on-year performance and identify seasonal trends.
Tabs across the top of the chart allow you to filter data by subsystem, providing a system-by-system analysis (e.g. Auxilary, Heating, Lighting etc,.).
.png?width=670&height=563&name=Twinview%20(1).png)
By default, the chart displays energy usage (kWh). You can switch the view to cost (£) to see the same data represented in monetary value, based on your configured energy tariff.

Monthly Analysis by Floor
The Monthly Analysis by Floor table summarises last month’s energy consumption broken down by floor level.
Where available, it includes additional metrics that help explain variations in energy use.
Currently, the following metrics are displayed:
-
kWh/m² – Total energy consumption on the floor last month
-
Average Temperature – Average recorded temperature for the same period
-
Occupancy – Total number of people on the floor during the month
-
AQI – Average Air Quality Index for the month
These values help you understand how environmental or occupancy factors influence consumption patterns.

Energy Source Breakdown
The Energy Source Breakdown section displays the sources of your energy, based on data provided by your energy supplier and tariff configuration.
This breakdown is either:
-
Pulled directly from your energy provider’s API, or
-
Defined manually within your tariff settings if no API connection is available.

Energy Use Breakdown
The Energy Use Breakdown chart helps you understand how different building systems contributed to last months energy consumption.
It displays each system’s energy use against both the TM54 baseline and previous year’s performance, enabling compliance with TM54 methodology and supporting ongoing optimisation.
.png?width=670&height=390&name=Twinview%20(2).png)
Using the Dashboard Without Full TM54 Metering
Even if your building is not fully metered in accordance with TM54 requirements, you can still use the Energy Performance and Insights dashboard as long as you have at least one meter monitoring total energy consumption.
To do this:
-
Associate the relevant IoT Data Stream with the correct energy category (e.g. Electric, Gas).
-
Assign the single meter to the “Other” option within the energy category.
This approach allows the dashboard to function effectively, even with partial data coverage.